


There are different ways to create dynamic filtering in Power BI and one of my favourite techniques is using Calculation Groups. Calculation Groups allow us to reuse measures dynamically. Before, creating Calculation Groups required external tools like Tabular Editor, but now we can create them directly in the Model View of Power BI Desktop.
What You’ll Need
To achieve this pattern you need five components working together:
- Calculation Group — applies relative date logic to any measure
- Disconnected Calculated Table — powers the TopN slicer
- Calculated Column — creates user-friendly labels for the TopN slicer
- Visual Level Filter Measure — limits visuals to the top N items
- Base Measure — the KPI you are tracking (e.g. Total Revenue)
Calculation Group
The Calculation Group is the engine of the relative date filter. Each Calculation Item applies a different time window to whatever measure is in context.
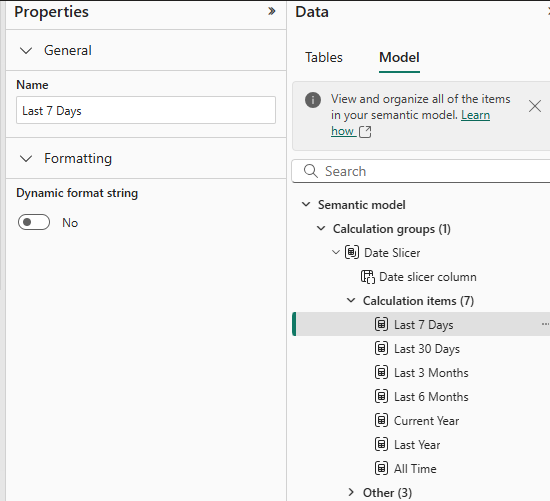
Last 7 Days
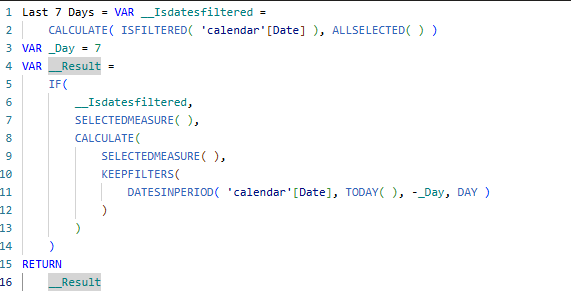
To reuse this pattern for other periods, simply change the value of _Day:
- Last 30 Days →
VAR _Day = 30 - Last 3 Months →
VAR _Day = 90 - Last 6 Months →
VAR _Day = 180
Current Year
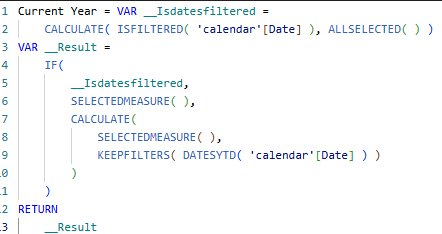
For Last Year, wrap SAMEPERIODLASTYEAR() around DATESYTD().
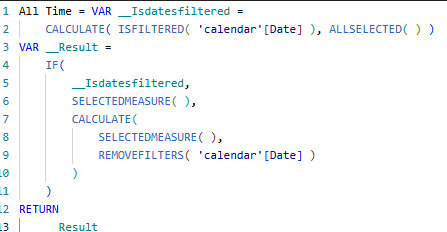
All Time
Disconnected Calculated Table & TopN Selector
For the TopN filter I created a disconnected calculated table. A Calculated Column (TopN Label) is added to make the slicer labels more user-friendly.
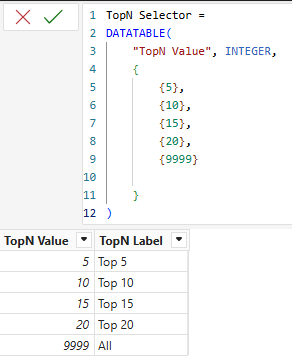
The TopN Label column is defined as:
TopN Label =
IF(
    'TopN Selector'[TopN Value] = 9999,
    "All",
    "Top " & FORMAT('TopN Selector'[TopN Value], "0")
)
This converts raw numbers into readable labels — 9999 becomes "All", and 10 becomes "Top 10".
Visual Level Filter Measure
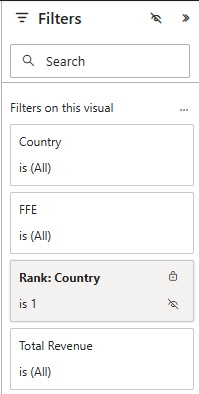
I use the measure below in the visual level filter and set the filter to show values equal to 1. This restricts the visual to only render the top N countries based on the slicer selection.
Rank: Country =
VAR __SelectedTopN = SELECTEDVALUE('TopN Selector'[TopN Value])
VAR __Rank =
    RANKX(
        ALLSELECTED(Countries[Country]),
        [Total Revenue (USD)],
        ,
        DESC
    )
RETURN
    IF(__Rank <= __SelectedTopN, 1, 0)
When Rank: Country = 1, the country is within the selected TopN and is shown. When it equals 0, it is filtered out.
Base Measure
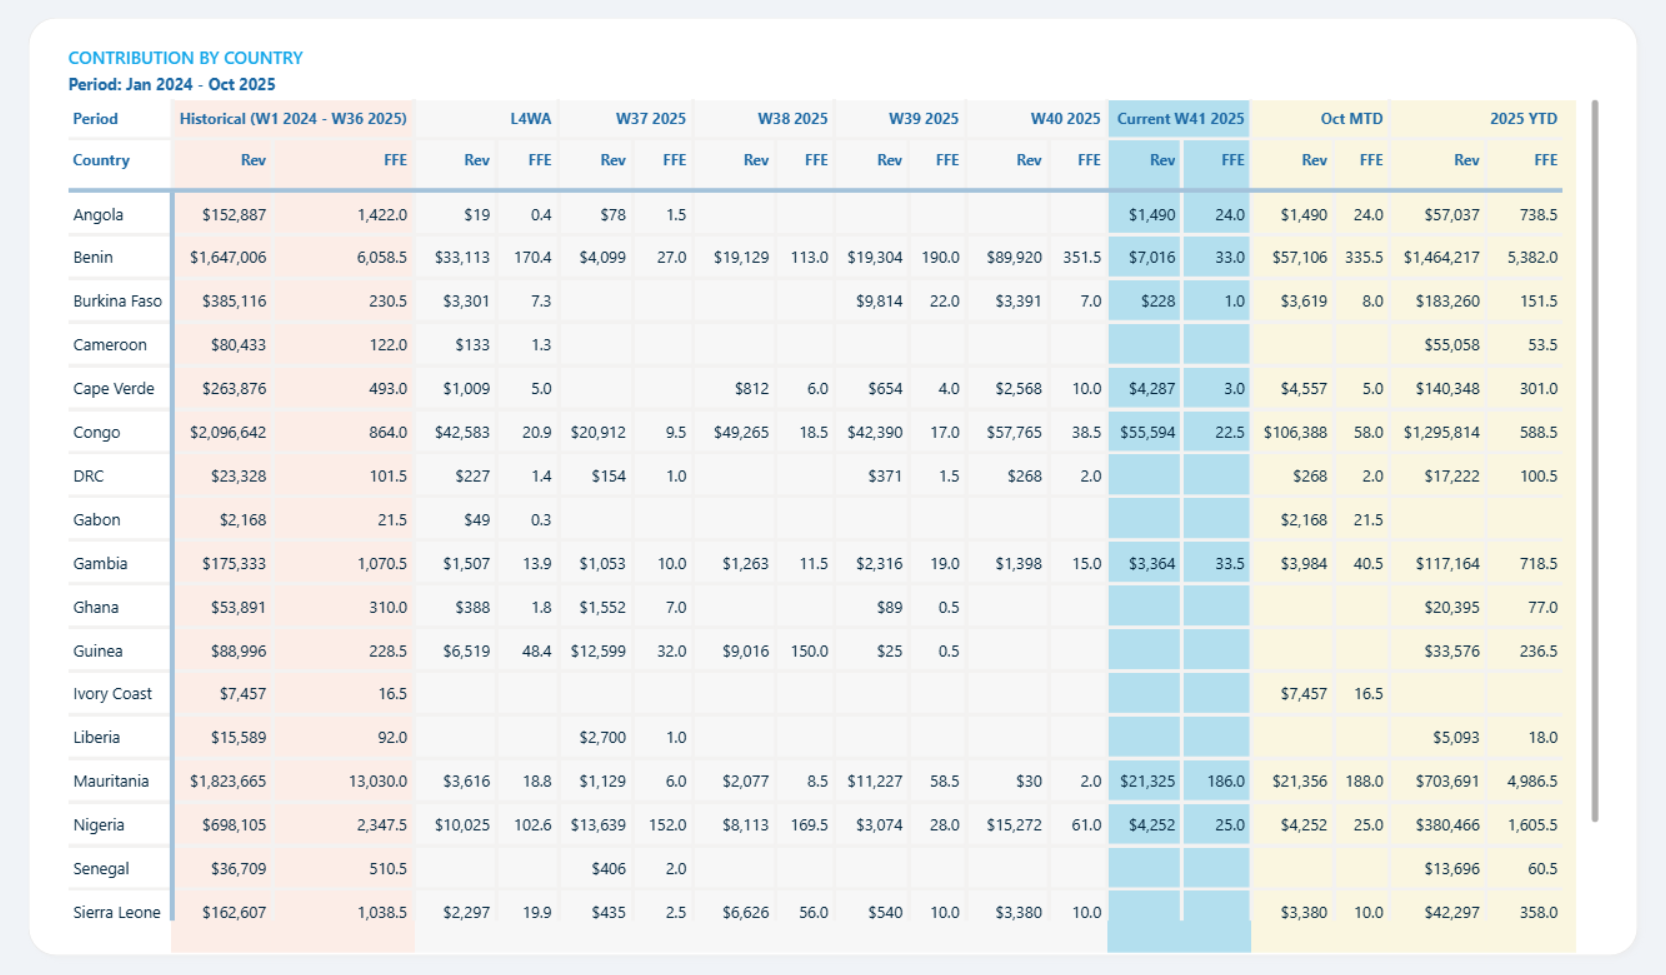
The base measure can be any KPI you are tracking. In this example it is [Total Revenue (USD)], wrapped in a date filter that respects the Calculation Group selection.
Total Revenue As Of Selected Period =
CALCULATE(
    [Total Revenue (USD)],
    FILTER(
        'calendar',
        'calendar'[Date] <= [As on Date]
    )
)
The [As on Date] measure returns the date selected by the user, or falls back to the maximum available date if nothing is selected:
As on Date =
COALESCE(
    SELECTEDVALUE('Disconnected Calendar'[Date], BLANK()),
    MAX('Disconnected Calendar'[Date])
)
Putting all five components together gives you a fully dynamic report where users can switch between time periods (Last 7 Days, Last 30 Days, Current Year, etc.) and simultaneously control which top N items appear in the visual — all without touching a single filter pane setting.