


UDF is the new cool thing in Power BI. Announced just about two weeks ago, you can now define your own functions as you would in a traditional programming language like Python, and reuse them everywhere in your semantic model.
The two major benefits are:
- Reusability — Define a function once and call it across multiple measures.
- Centralised logic — Since it lives in one place, it is easy to maintain and update. This is especially powerful when calculating variances and rendering SVG icons.
I’ll demonstrate how I use UDF to show Up/Down SVG trend indicator icons in a matrix table visual.
Before UDF
If I want to calculate variance (Actual vs Previous, or Actual vs Target) and show an Up/Down indicator based on whether the variance is positive or negative, I use SVG icons — they look aesthetically better than Power BI’s default icons.
Tip: You don’t need to write SVG code yourself. Copy icons from any of these sources:
For the matrix visual, I had 7 measures each needing the same SVG icon logic — Up, Down, and Neutral. That’s 21 SVG measures in total, all repeating the same pattern:
SVG Icons CF: Current Week vs Target =
VAR __variance = [Diff: Current Week vs Target]
VAR __iconUp =
    "data:image/svg+xml;utf8,<svg xmlns='http://www.w3.org/2000/svg' width='20' height='20' fill='%23018B77' class='bi bi-arrow-up-circle-fill' viewBox='0 0 16 16'><path d='M16 8A8 8 0 1 0 0 8a8 8 0 0 0 16 0m-7.5 3.5a.5.5 0 0 1-1 0V5.707L5.354 7.854a.5.5 0 1 1-.708-.708l3-3a.5.5 0 0 1 .708 0l3 3a.5.5 0 0 1-.708.708L8.5 5.707z'/></svg>"
VAR __iconDown =
    "data:image/svg+xml;utf8,<svg xmlns='http://www.w3.org/2000/svg' width='20' height='20' fill='%23CC426B' class='bi bi-arrow-down-circle-fill' viewBox='0 0 16 16'><path d='M16 8A8 8 0 1 1 0 8a8 8 0 0 1 16 0M8.5 4.5a.5.5 0 0 0-1 0v5.793L5.354 8.146a.5.5 0 1 0-.708.708l3 3a.5.5 0 0 0 .708 0l3-3a.5.5 0 0 0-.708-.708L8.5 10.293z'/></svg>"
VAR __iconNeutral =
    "data:image/svg+xml;utf8,<svg xmlns='http://www.w3.org/2000/svg' width='20' height='20' fill='%23FFFFFF' class='bi bi-arrow-right-circle-fill' viewBox='0 0 16 16'><path d='M8 0a8 8 0 1 1 0 16A8 8 0 0 1 8 0M4.5 7.5a.5.5 0 0 0 0 1h5.793l-2.147 2.146a.5.5 0 0 0 .708.708l3-3a.5.5 0 0 0 0-.708l-3-3a.5.5 0 1 0-.708.708L10.293 7.5z'/></svg>"
RETURN
SWITCH(
    TRUE(),
    __variance > 0, __iconUp,
    __variance < 0, __iconDown,
    __iconNeutral
)
Multiply that across 7 measures and you have a maintenance nightmare. Change the icon style once and you’re hunting through 21 measures to update it.
With UDF
With UDF, I only need to define the logic once as a reusable function and call it everywhere.
Step 1 — Define the Function
In Power BI Desktop, go to the DAX Query View or TMDL View — these are the two places where you can author a UDF.
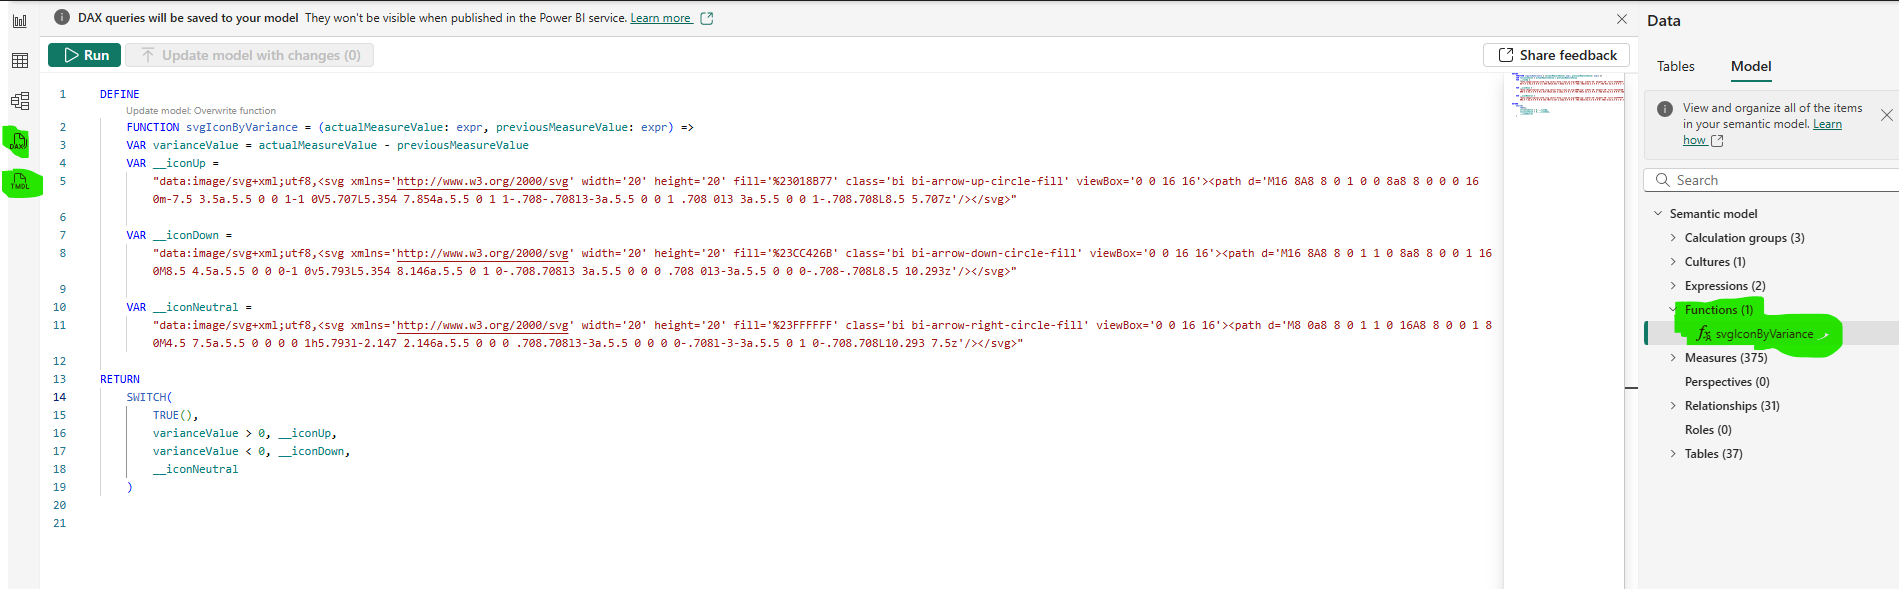
Define your function and click “Update model with changes”. The function name will then appear under Functions in your semantic model.
Here is the full function definition:
DEFINE
    FUNCTION svgIconByVariance = (actualMeasureValue: expr, previousMeasureValue: expr) =>
    VAR varianceValue = actualMeasureValue - previousMeasureValue
    VAR __iconUp =
        "data:image/svg+xml;utf8,<svg xmlns='http://www.w3.org/2000/svg' width='20' height='20' fill='%23018B77' class='bi bi-arrow-up-circle-fill' viewBox='0 0 16 16'><path d='M16 8A8 8 0 1 0 0 8a8 8 0 0 0 16 0m-7.5 3.5a.5.5 0 0 1-1 0V5.707L5.354 7.854a.5.5 0 1 1-.708-.708l3-3a.5.5 0 0 1 .708 0l3 3a.5.5 0 0 1-.708.708L8.5 5.707z'/></svg>"

    VAR __iconDown =
        "data:image/svg+xml;utf8,<svg xmlns='http://www.w3.org/2000/svg' width='20' height='20' fill='%23CC426B' class='bi bi-arrow-down-circle-fill' viewBox='0 0 16 16'><path d='M16 8A8 8 0 1 1 0 8a8 8 0 0 1 16 0M8.5 4.5a.5.5 0 0 0-1 0v5.793L5.354 8.146a.5.5 0 1 0-.708.708l3 3a.5.5 0 0 0 .708 0l3-3a.5.5 0 0 0-.708-.708L8.5 10.293z'/></svg>"

    VAR __iconNeutral =
        "data:image/svg+xml;utf8,<svg xmlns='http://www.w3.org/2000/svg' width='20' height='20' fill='%23FFFFFF' class='bi bi-arrow-right-circle-fill' viewBox='0 0 16 16'><path d='M8 0a8 8 0 1 1 0 16A8 8 0 0 1 8 0M4.5 7.5a.5.5 0 0 0 0 1h5.793l-2.147 2.146a.5.5 0 0 0 .708.708l3-3a.5.5 0 0 0 0-.708l-3-3a.5.5 0 1 0-.708.708L10.293 7.5z'/></svg>"
RETURN
    SWITCH(
        TRUE(),
        varianceValue > 0, __iconUp,
        varianceValue < 0, __iconDown,
        __iconNeutral
    )
The function takes two parameters — actualMeasureValue and previousMeasureValue — calculates the variance internally, and returns the correct SVG string.
Step 2 — Use the Function
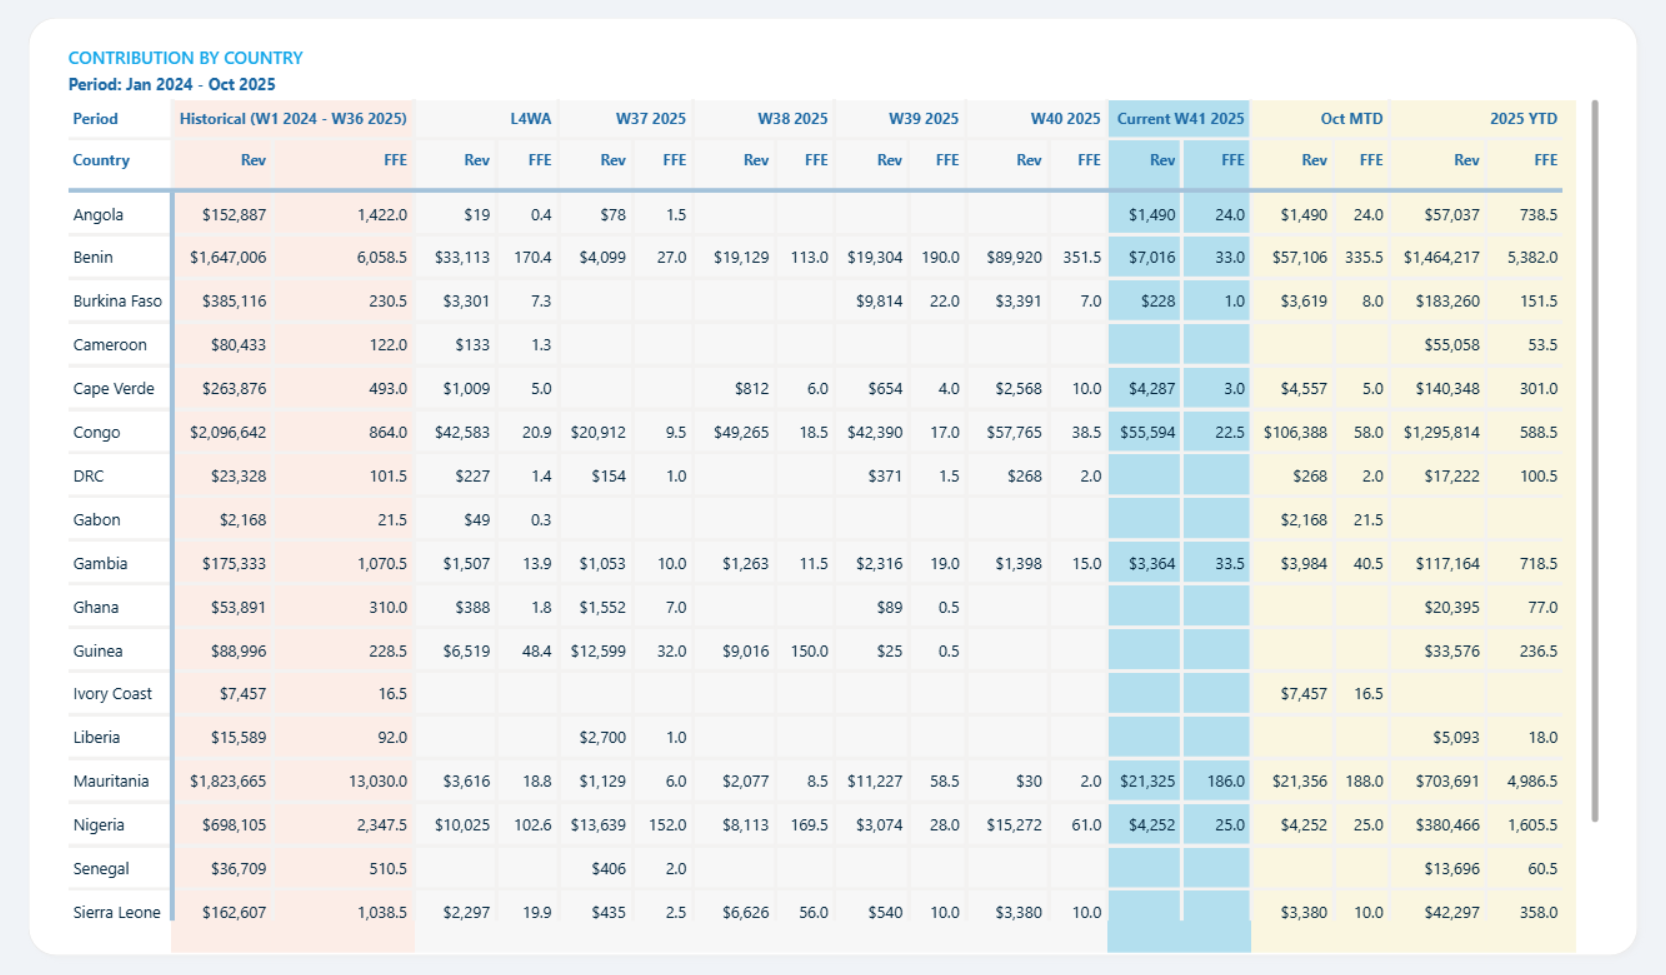
Back in the Report view, calling the function in any measure is as simple as typing its name and passing the two parameters. In the image below you can see the 7 conditional formatting measures — the old repetitive code is commented out and replaced with a single function call each.
In this case I was calculating weekly First Mile (LnS) performance against Area Targets, sourced from the LnS Daily Cube.
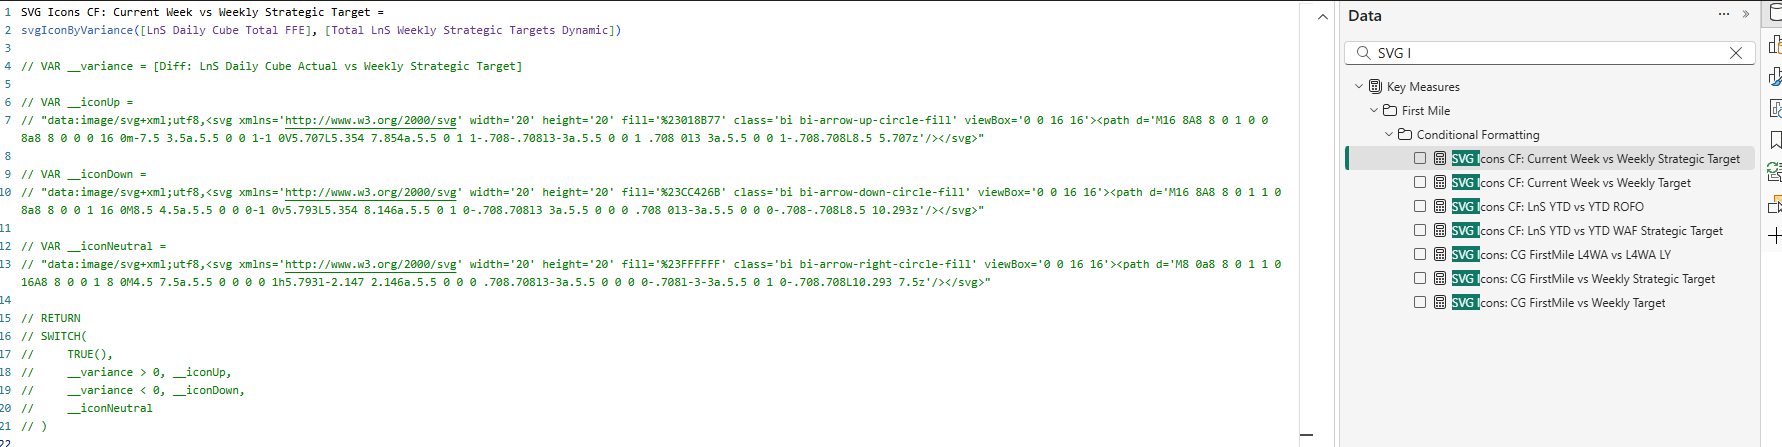
The result is clean, reusable icons across the entire matrix. And the real win comes later: if the icon style needs to change, I update it once in the function definition and every single measure picks it up automatically — no hunting, no copy-pasting.
UDF is one of those features that feels small on paper but has an immediate, meaningful impact on how you structure and maintain a semantic model.